Now, we will analytically examine the laser model in order to gain
insight as to what is really going on beneath the pictures. First
we will determine the fixed points of the system. The fixed
points of a system are the points where the system is not changing as time
goes on, that is, ![]() and
and
![]() are equal to zero at the fixed point
(e, n.)
That is,
are equal to zero at the fixed point
(e, n.)
That is,
![]()
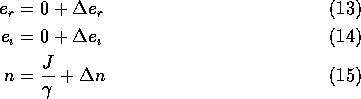
Solving these equations yields the fixed point
(e = 0, ![]() ).
).
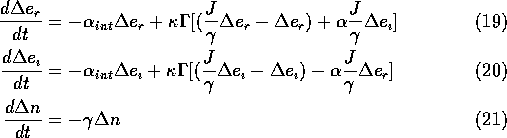
Our next step is to calculate the stability of this fixed point.
(There may be other fixed points, but we will not consider them here.)
In order to do this, we will simplify the system by means of
linearization, a process which describes the behavior of the
system close to the
fixed point. To linearize, we make a change of variables in our
system of real equations (that is, using ![]() and
and ![]() ):
):
Substituting these values into our original system, we get:
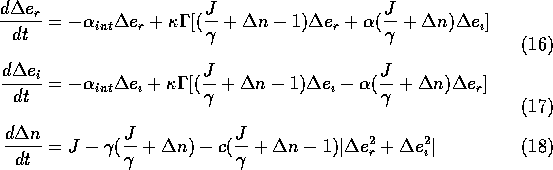
Since we are only looking at the system close to the fixed point,
![]() is a relatively small change. One expects terms in
is a relatively small change. One expects terms in ![]() ,
,
![]() , or
, or ![]() of higher
order than one will be even smaller. We will therefore neglect these
higher-order terms, leaving us with a linear system. That
system is:
of higher
order than one will be even smaller. We will therefore neglect these
higher-order terms, leaving us with a linear system. That
system is:
Notice that the term on the right hand side of the last equation is always
less than zero if ![]() is
positive, and greater than zero if
is
positive, and greater than zero if ![]() is negative.
This means that
is negative.
This means that ![]() tends toward zero, a trend we call
stability. It remains to be seen if e is stable. To do this,
we will find a threshold value for J, called
tends toward zero, a trend we call
stability. It remains to be seen if e is stable. To do this,
we will find a threshold value for J, called
![]() , at which the stability of e changes. Consider Eqn. (19)
with
, at which the stability of e changes. Consider Eqn. (19)
with ![]() :
:
Notice that the right-hand side of this equation is of the form ![]() , where
, where
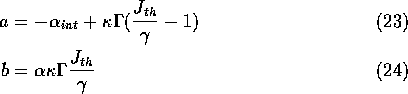
When this form is encoutered in a differential equation, we can re-write the equation (Eqn. 22) as:
![]()
If ![]() then
then
![]() will grow, and if a < 0 it will decay to zero.
From this we see that the threshold value,
will grow, and if a < 0 it will decay to zero.
From this we see that the threshold value, ![]() , for stability occurs
when a = 0, i. e.,
, for stability occurs
when a = 0, i. e.,
![]()
Solving this equation for ![]() gives the value for J at which the
stability of e changes, as desired.
gives the value for J at which the
stability of e changes, as desired.
![]()
For ![]() , a is negative, which means
e = 0 is linearly stable. On the other hand, for
, a is negative, which means
e = 0 is linearly stable. On the other hand, for ![]() , e = 0 is
unstable. This change in the stability of a fixed point is called a
bifurcation.
, e = 0 is
unstable. This change in the stability of a fixed point is called a
bifurcation.
Thus, when J becomes greater than ![]() , the fixed point becomes
unstable, and a periodic
solution of the system is born. Recall from our discussion of the
trajectories of the system that if the value of J is too low, the value
of e will approach 0 instead of a periodic solution. This corresponds
exactly to the periodic solution born at
, the fixed point becomes
unstable, and a periodic
solution of the system is born. Recall from our discussion of the
trajectories of the system that if the value of J is too low, the value
of e will approach 0 instead of a periodic solution. This corresponds
exactly to the periodic solution born at ![]() . That is, if J is
below
. That is, if J is
below ![]() , the laser will not begin lasing, rather,
|e| will go to zero, as discussed earlier in
Figures [2(a)-(b)]. This will become clear when we
draw the bifurcation diagram of the system. A bifurcation diagram
is a picture showing how the
fixed points of a system change as a parameter is varied. Figures
[3-4] show
two bifurcation diagrams of our laser system.
, the laser will not begin lasing, rather,
|e| will go to zero, as discussed earlier in
Figures [2(a)-(b)]. This will become clear when we
draw the bifurcation diagram of the system. A bifurcation diagram
is a picture showing how the
fixed points of a system change as a parameter is varied. Figures
[3-4] show
two bifurcation diagrams of our laser system.
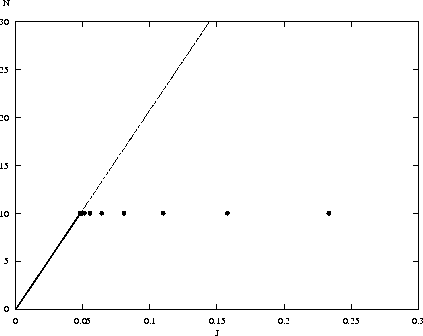
Figure 3: Bifurcation diagram, J vs. N(=n)
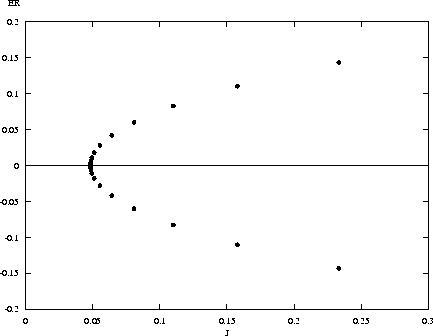
Figure 4: Bifurcation diagram, J vs. ER(=A)
These bifurcation diagrams, drawn with AUTO, show the stability of the
fixed point as the parameter J varies from 0 to 0.3, and all other
parameters are fixed at the realistic values given earlier.
Figure [3]
shows
how the value of the n component of the fixed point changes as J is
increased, while Figure [4] shows how the A component of the
fixed
point
changes as J changes. The
thick line denotes stability of the fixed point, while the thin line
denotes instability. The point at which the fixed point becomes unstable
is exactly the value of ![]() . When J is above this value, the fixed
point is unstable,
when it is below this value, it is stable, just as we calculated
earlier. What we did not calculate earlier is the existence of periodic
solutions, denoted by the dots in the bifurcation diagrams. These periodic
solutions show the type of behavior we saw in the orbits of the system:
n settles to a certain value, and e rotates at a fixed radius in the
complex plane. However, our bifurcation diagrams tell us even more than
that. They tell us that no matter how high we turn up J, we will never
get an increase in n. We will, however, get an increase in e, although
our rate of gain of e decreases as J increases. This is highly useful
information for understanding how our laser works! We now know that the
periodic solution's value of n cannot be increased by simply adding more
energy. We also know how much energy needs to be put into the system in
order for the laser to begin lasing.
. When J is above this value, the fixed
point is unstable,
when it is below this value, it is stable, just as we calculated
earlier. What we did not calculate earlier is the existence of periodic
solutions, denoted by the dots in the bifurcation diagrams. These periodic
solutions show the type of behavior we saw in the orbits of the system:
n settles to a certain value, and e rotates at a fixed radius in the
complex plane. However, our bifurcation diagrams tell us even more than
that. They tell us that no matter how high we turn up J, we will never
get an increase in n. We will, however, get an increase in e, although
our rate of gain of e decreases as J increases. This is highly useful
information for understanding how our laser works! We now know that the
periodic solution's value of n cannot be increased by simply adding more
energy. We also know how much energy needs to be put into the system in
order for the laser to begin lasing.